
-
 Indicators MT4 1688ea Breakout indicator MT4
$69.00
$99.00 -
Indicators MT5 1688ea Breakout indicator MT5
$69.00
$199.00 -
Indicators MT5 Breakout indicator MT5(Highly accurate signal)
$69.00
$99.00 -
Mobile Background A minimal and elegant image of cherry blossoms
- Immediatly Available
- 3840 x 2160 / 2560*1600 / 1920 x 1080 / 1024*780 / 1280 x 720
- Full HD, Lifetime Licence
$0.99
$1.79
1688ea Breakout indicator MT4
Category: Indicators MT4.
$69.00$99.00
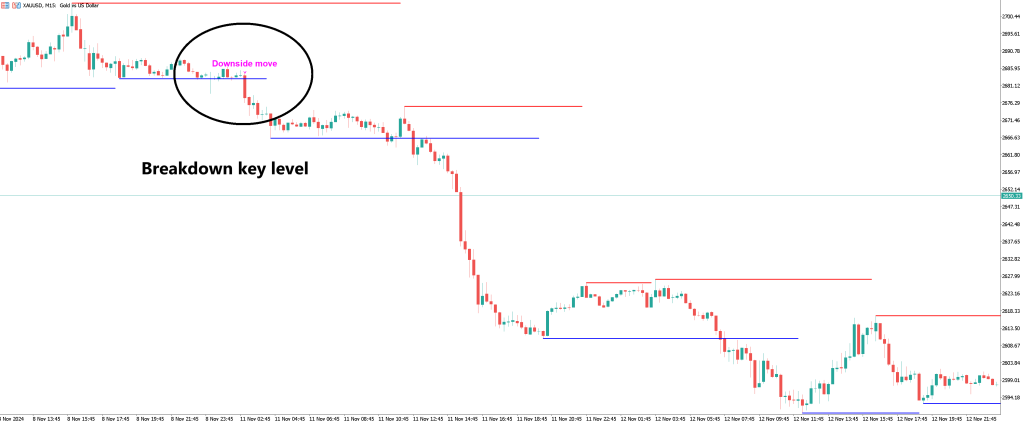
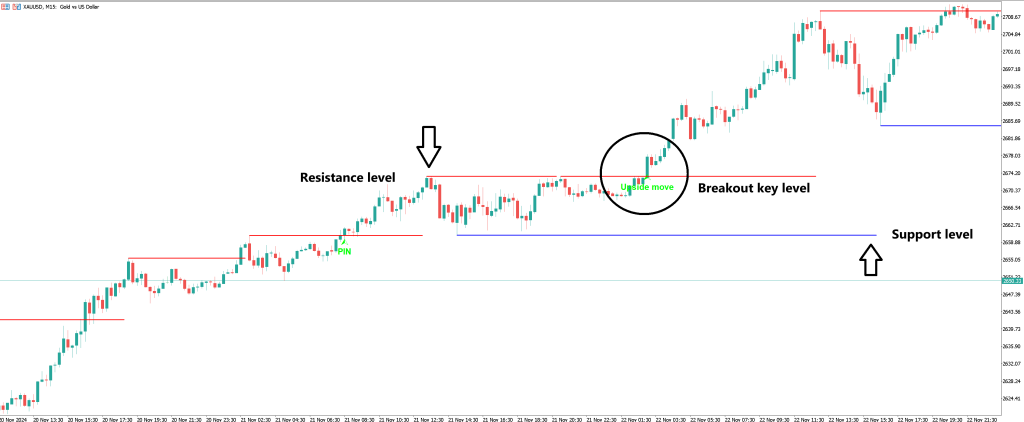
Enhance your market analysis with our advanced pivot point tool, providing support and resistance thresholds and filtered break signals. Using the Volume Oscillator, it highlights impactful breaks and identifies trend changes with bullish candle patterns, ensuring clarity and precision in trading decisions.


 Login with Google
 Login with Facebook