-
 Mobile Background A breathtaking futuristic cityscape
- Immediatly Available
- 3840 x 2160 / 2560*1600 / 1920 x 1080 / 1024*780 / 1280 x 720
- Full HD, Lifetime Licence
$1.69
$3.79 -
Mobile Background A delicate close-up of cherry blossoms
- Immediatly Available
- 3840 x 2160 / 2560*1600 / 1920 x 1080 / 1024*780 / 1280 x 720
- Full HD, Lifetime Licence
$0.99
$1.79 -
Indicators MT5 Chande Kroll take profit indicator MT5
$39.00
$99.00 -
Indicators MT4 Pearson Correlation Plus MT4 Indicator
$319.00
$399.00
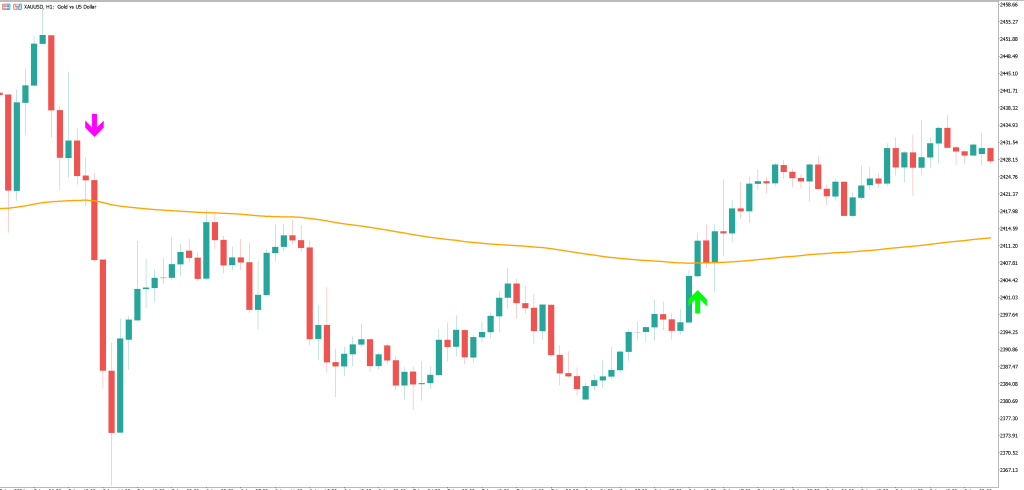
Breakout indicator MT5(Highly accurate signal)
Category: Indicators MT5.
$69.00$99.00
Key Features Adaptive Support and Resistance ZonesThis indicator determines price boundaries by identifying the highest (resistance) and lowest (support) points within a customizable timeframe. These points dynamically adjust to market activity, providing traders with real-time insights. Signal Filtering by Market ConditionsTo reduce redundant signals, the indicator incorporates market state awareness. Once a breakout occurs, further […]


 Login with Google
 Login with Facebook