Indicator Features and Customizable Settings Visual Trend Signals The indicator uses distinct colors to represent market trends clearly: Turquoise Bars: When a candle closes above the upper boundary line, the bar is shaded in turquoise, signaling an uptrend. Fuchsia Bars: Conversely, if a candle closes below the lower boundary line, the bar turns fuchsia, indicating […]
The indicator uses distinct colors to represent market trends clearly:
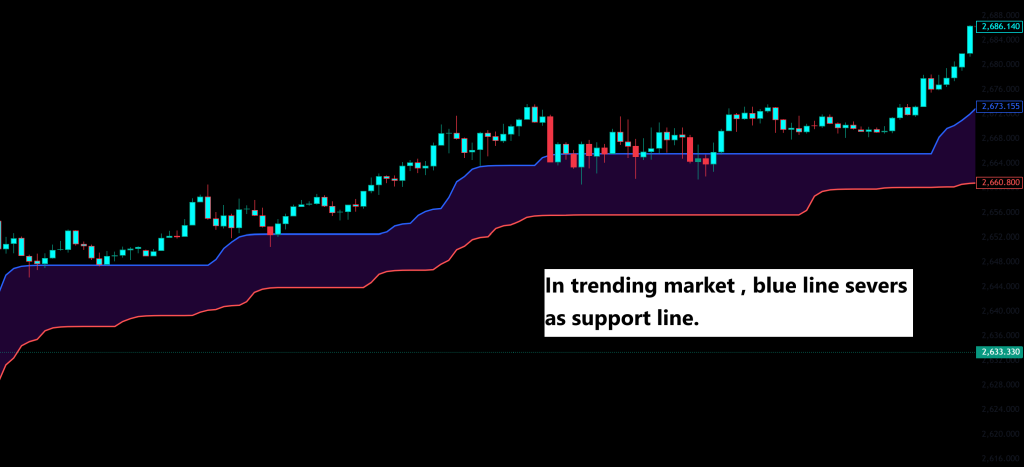
Turquoise Bars: When a candle closes above the upper boundary line, the bar is shaded in turquoise, signaling an uptrend.
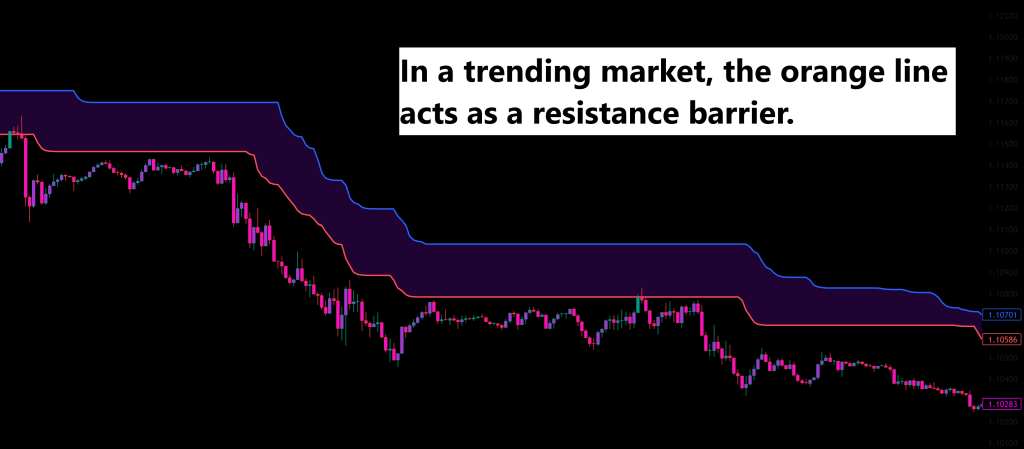
Fuchsia Bars: Conversely, if a candle closes below the lower boundary line, the bar turns fuchsia, indicating a downtrend.
These color changes provide immediate visual cues about the market's direction, allowing traders to quickly assess trend movements.
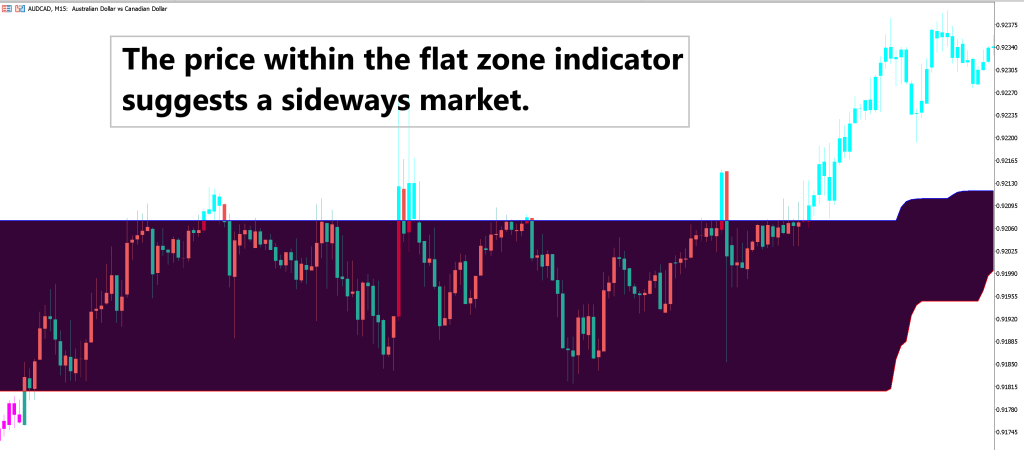
Flat Zone Identification
In addition to trend signals, the indicator highlights a Flat Zone to emphasize periods of sideways market activity. During these times, the market lacks a clear direction, and the Flat Zone advises traders to hold off on making trades to avoid potential risks associated with uncertain market conditions.
Three Key Adjustable Parameters
This indicator offers three main quantitative parameters that can be customized to fit different trading strategies:
Period/Length
Trend Sensitivity: A shorter period increases the indicator’s responsiveness to minor trend changes, making it effective for capturing short-term price movements. Conversely, a longer period decreases sensitivity, helping to filter out smaller fluctuations and focus on more significant trends.
Trend Focus Alignment: Selecting the appropriate period is crucial as it aligns the indicator’s responsiveness with the trader’s interest in either short-term or long-term trends.
Belt Percent
Optimization Factor: This parameter serves as an optimization coefficient.
Short-term vs. Long-term Trends: Lower belt percent values enhance the indicator’s ability to detect short-term fluctuations, while higher values make it more suitable for identifying long-term trends.
Highest and Lowest Length
Calculation Basis: These settings determine the range used for the indicator’s calculations.
Moving Average Options: By default, the indicator utilizes the Variable Index Dynamic Moving Average (VIDYA). However, traders can choose from ten different Moving Average types to better suit their analytical needs:
SMA: Simple Moving Average
EMA: Exponential Moving Average
DEMA: Double Exponential Moving Average
WMA: Weighted Moving Average
TMA: Triangular Moving Average
VAR: Variable Index Dynamic Moving Average (VIDYA)
WWMA: Welles Wilder's Moving Average
ZLEMA: Zero Lag Exponential Moving Average
TSF: True Strength Force
HULL: Hull Moving Average
Practical Application and Strategy
By adjusting the Period/Length and Belt Percent parameters, traders can fine-tune the indicator’s sensitivity to match their trading style:
Shorter Period + Lower Belt Percent: Ideal for day traders looking to capitalize on rapid market changes and short-term opportunities.
Longer Period + Higher Belt Percent: Suited for swing traders who prefer to focus on more stable, long-term trends.
Additionally, the ability to select different Moving Average types allows traders to customize the indicator further, enhancing its adaptability across various market conditions and trading strategies.
Summary
This indicator provides clear visual signals for identifying uptrends and downtrends through color-coded bars and highlights sideways market conditions with a Flat Zone. With three adjustable parameters—Period/Length, Belt Percent, and Highest and Lowest Length—traders can tailor the indicator to their specific needs, balancing sensitivity and stability. The extensive range of Moving Average options further enhances its flexibility, making it a valuable tool for both short-term and long-term trading strategies.
In order to give you the best experience, we use cookies and similar technologies for performance, analytics, personalisation, advertising, and to help our site function. Want to know more? Read our Cookie Policy
 Mobile Background A graceful woman in traditional attire
 Login with Google
 Login with Facebook