
-
 Indicators MT4 Chande Kroll take profit indicator MT4
$39.00
$99.00 -
Mobile Background Green bamboo stalks and leaves
- Immediatly Available
- 3840 x 2160 / 2560*1600 / 1920 x 1080 / 1024*780 / 1280 x 720
- Full HD, Lifetime Licence
$0.99
$1.79 -
Exclusive Membership Diamond VIP
- 10 Live Account License
- Unlimited Demo Licenses
- Free Updates for Life
- Easy Installation Videos
- High Performance Settings
- Lifetime Membership
$2,399.00 – $2,999.00
-
Indicators MT4 ATR Stop Loss with Trade Signal for MT4
$39.00
$79.00
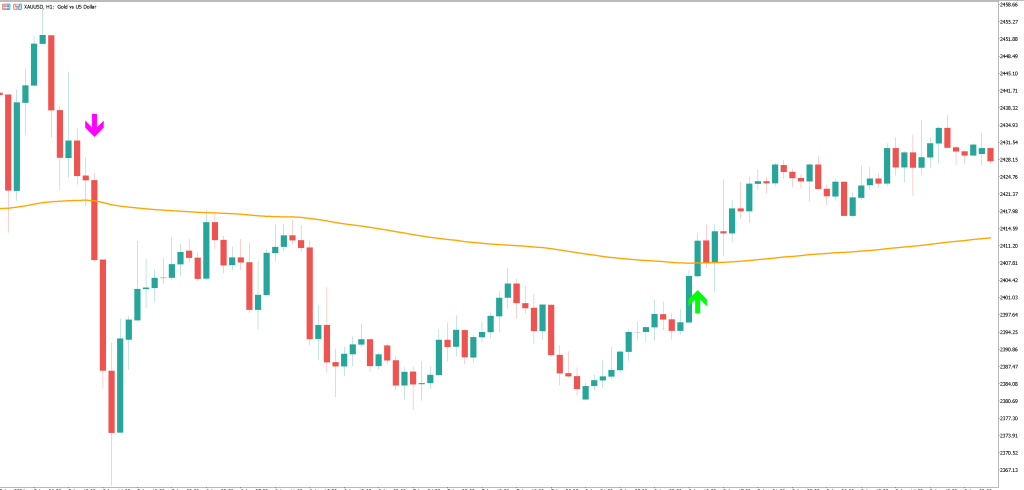
Breakout indicator MT4 (Highly accurate signal)
Category: Indicators MT4.
$69.00$99.00
Discover tools for breakout trading with strategies, price resistance analysis, real-time insights, and entry indicators. Perfect for trend markets, ADX, and 200 EMA strategies.


 Login with Google
 Login with Facebook